Debugging Tools
Debugging Tools
The following techniques and tools can help you debug scripts and gain information about what went wrong.
Output Window
The Output window (View → Output) is a simple but powerful debugging tool. It displays errors captured from running scripts, messages from the Roblox engine, and user-defined messages/errors generated by print() and warn() commands.
The output can be customized as follows:
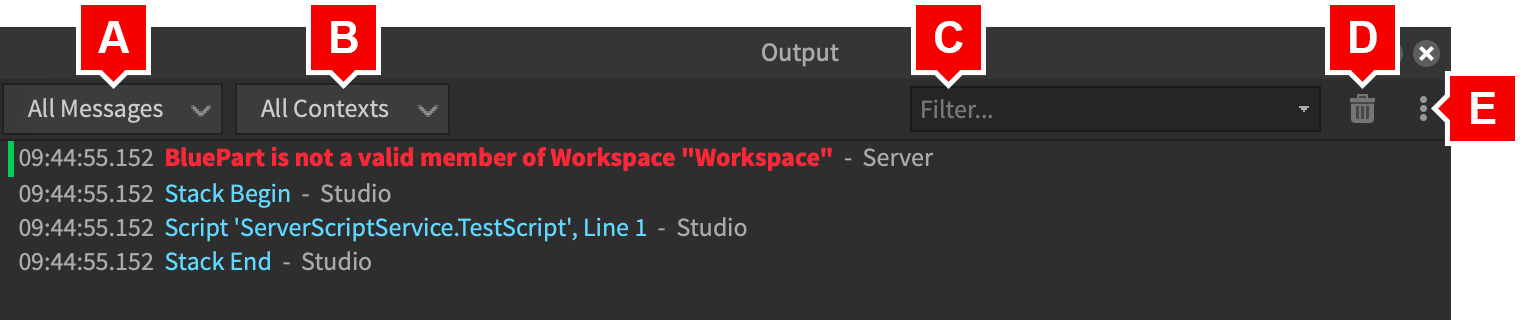
- Show Timestamp — Shows a detailed timestamp in HH:MM:SS.SSS format.
- Show Context — Shows the message context such as Client or Server.
- Show Source — If applicable, shows the associated script name and line number.
- Show Tables Expanded by Default — For outputted tables, contents are expanded by default.
- Show Memory Address for Tables — For tables, shows the internal memory address such as
0xb4f0417581144ec5. - Log Mode — Simplifies output by removing options such as expandable trees.
Debugger
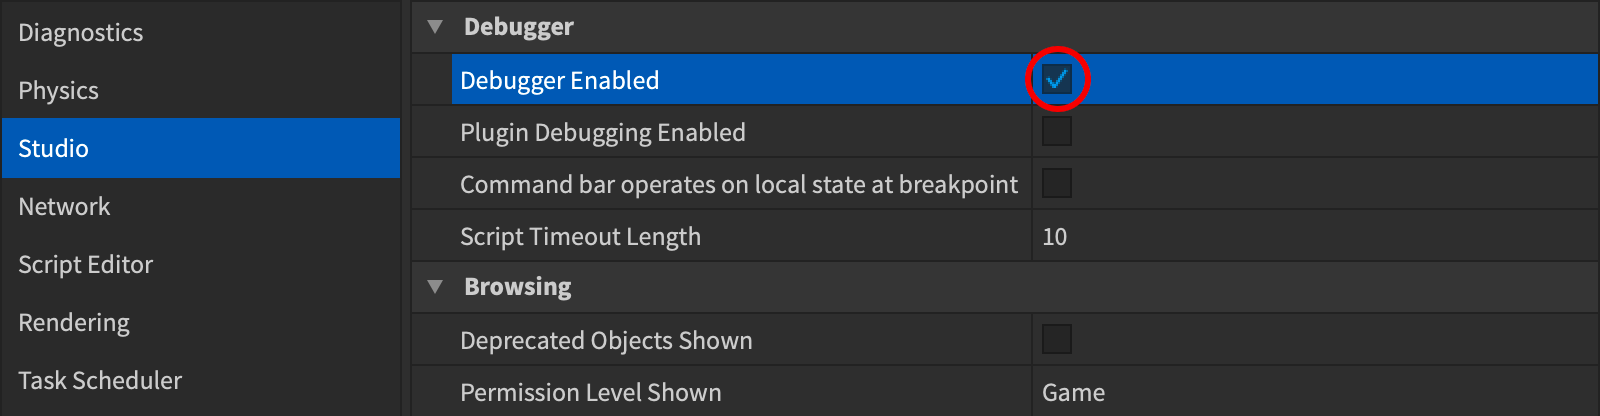
The built-in debugger offers utilities commonly found in an IDE (Integrated Development Environment). It is enabled by default but can be toggled on or off through the Studio Settings menu.
Breakpoints
Breakpoints are checkpoints that pause or “break” the execution of your scripts at specific lines. You can use the pauses to inspect and debug your experience, watch variables, and inspect the call stack. Breakpoints are one of the most effective ways to debug functions, and therefore one of the most important debugging tools.
You can configure breakpoints to break only if certain conditions are met, to print a message to the Output window, and to run only on the client or server. You can also mix these configurations together to best suit your debugging needs.
For more information, see Breakpoints.
Watching Variables
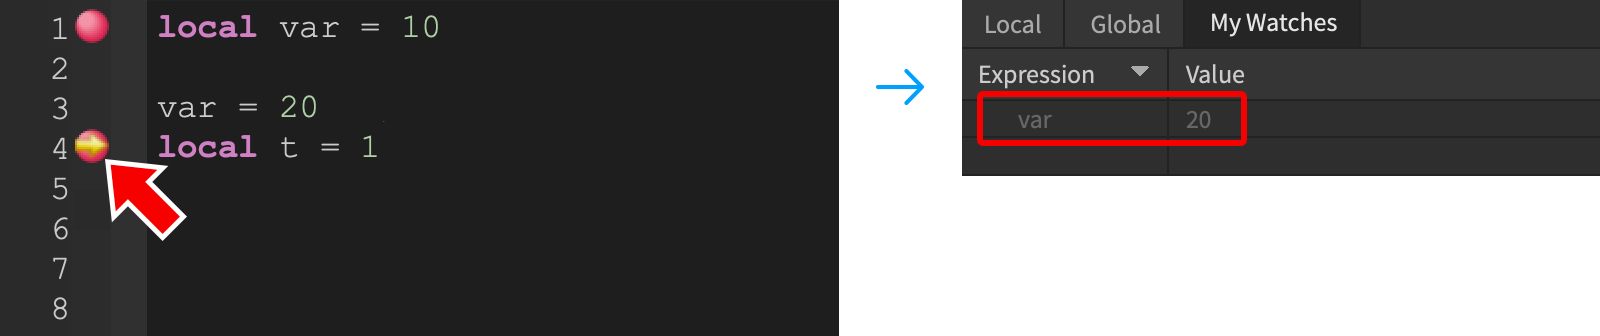
You can also tell the debugger to “watch” variables, keeping track of their value when you hit breakpoints. To add a variable to the watch list:
- Click the Add Watch button from the Script Menu tab.
- In the prompt window that opens, type in the variable’s name and confirm.
- From the Watch window that opens — also accessible through View → Watch — you can monitor the variable’s value as you step through breakpoints.
Call Stack
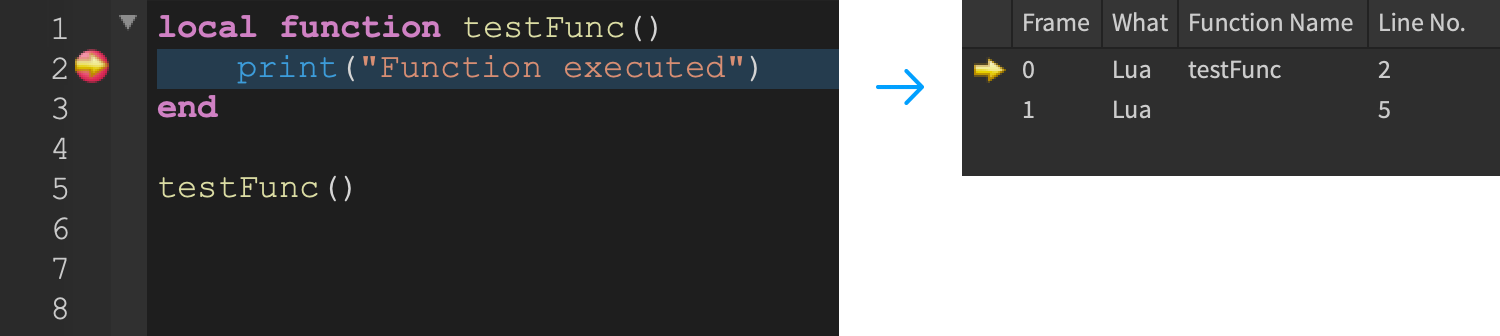
The Call Stack window tells you exactly where code execution is when paused or at a breakpoint.
- Open the Call Stack window from the View tab.
- Step through breakpoints and notice how the stack reflects the order of operations. If the current breakpoint is inside a function, the following item in the stack shows the line where the function was called.
Command Bar
The Command Bar is a powerful debugging tool, allowing you to test out literally any script command while the experience is running. The command bar is available in both Studio (View → Command Bar) and in the Articles/Developer Console.
Production Debugging
When testing a live version of your experience, the following production-level tools can assist in debugging.
Developer Console
The Articles/Developer Console provides a wide array of details including client and server output, memory usage, network performance, and more.
Log Files
Whenever a script running on your computer prints or errors, that message is recorded in a log file. These files are located in different places depending on the operating system:
- On Windows, type
%LOCALAPPDATA%\Roblox\logsinto the file explorer address bar and then sort the folder by date modified. Logs should have the formatlog_XXXXXfollowed by additional naming. All logs with the sameXXXXXvalue are from the same Studio session. - On macOS, logs are in the directory
~/Library/Logs/Roblox. In the Finder, click the Go menu, select Go to Folder, type in that directory, and confirm.